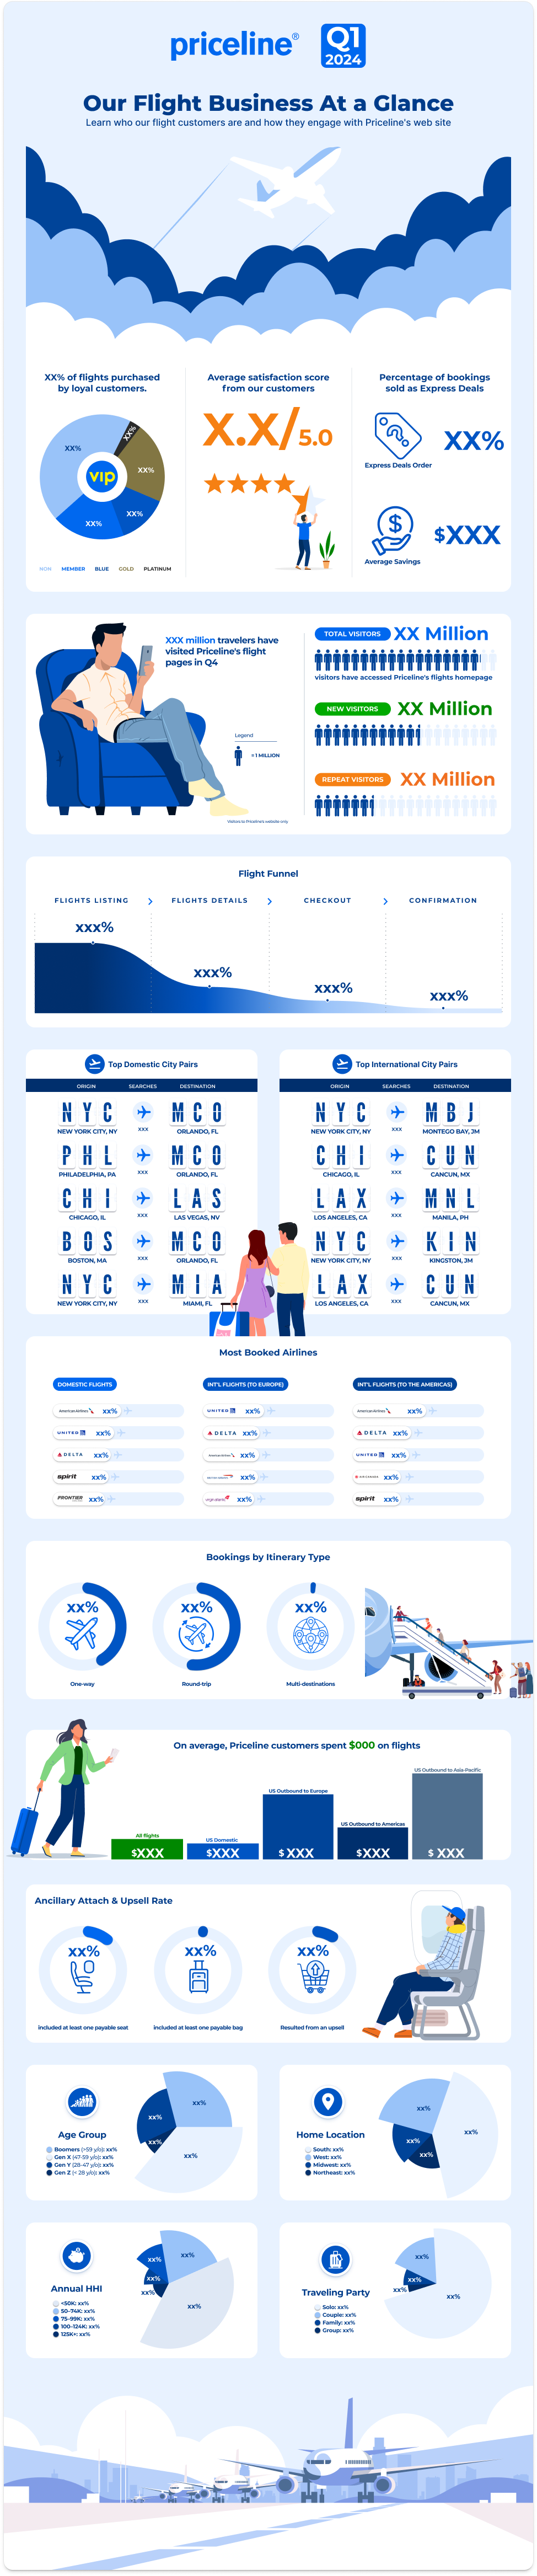
Overview: The Priceline Flight Business at a Glance project was designed to communicate critical behavioral analytics to internal stakeholders. This visually driven infographic simplified complex data into an easily digestible format, ensuring seamless decision-making and strategic alignment across teams.
My Role: I conceptualized, designed, and delivered the infographic entirely from scratch, focusing on clarity, accuracy, and alignment with Priceline’s brand identity. I transformed dense data sets into actionable insights by combining thoughtful layout design, typography, and strategic use of negative space.
Challenges & Solutions:
• Challenge: Presenting detailed analytics without overwhelming the viewer.
• Solution: Implemented a clear visual hierarchy with segmented data sections, enabling rapid comprehension.
• Challenge: Presenting detailed analytics without overwhelming the viewer.
• Solution: Implemented a clear visual hierarchy with segmented data sections, enabling rapid comprehension.
• Challenge: Maintaining engagement with internal stakeholders.
• Solution: Used dynamic graphics and carefully selected color palettes to highlight key points while adhering to
Priceline’s visual standards.
• Solution: Used dynamic graphics and carefully selected color palettes to highlight key points while adhering to
Priceline’s visual standards.
Impact:
• Enhanced team collaboration by delivering a resource that improved understanding of flight behavior trends
• across departments.
• Estimated a 15% improvement in comprehension and decision-making speed for key stakeholders.
• Delivered the project 20% faster than the standard timeline, reflecting efficiency and adaptability.
Feedback: Praised for its clarity and engaging presentation, the infographic was regarded as a benchmark for internal design projects.